
 |
| A screen capture from the multi-beam sonar Seafloor Information System (SIS). The image on the left shows swath coverage. The image on the right shows an active ping through the water column. |
Multi-beam sonar (swath seafloor mapping) data are collected, gridded (binned) to the predefined cell size, and output in two flavors. Bathymetric grids, which are essentially 3D topographic maps, and Backscatter grids, which display the reflectivity of the seafloor. The reflectivity varies due to both incidence angle of the respective beams and the density of the surface (e.g. hard rock, sediment etc). As the ship moves along at a given velocity, the multi-beam sonar sends a "ping" from the transducers (transmitters) to the seafloor and then waits until the receipt of the last return to ping again. The ping rate (Hz or 1/seconds) is a function of the depth of the ocean as well as the sound speed through water (XBT's are useful!). The swath width also scales as a function of depth. Our average depth is ~4800m (2.98 miles), which allows for an achievable swath width of ~20km (12.43 miles!).
 |
| Swath coverage display of the backscatter (reflectivity of the seafloor) collected across a swath. |
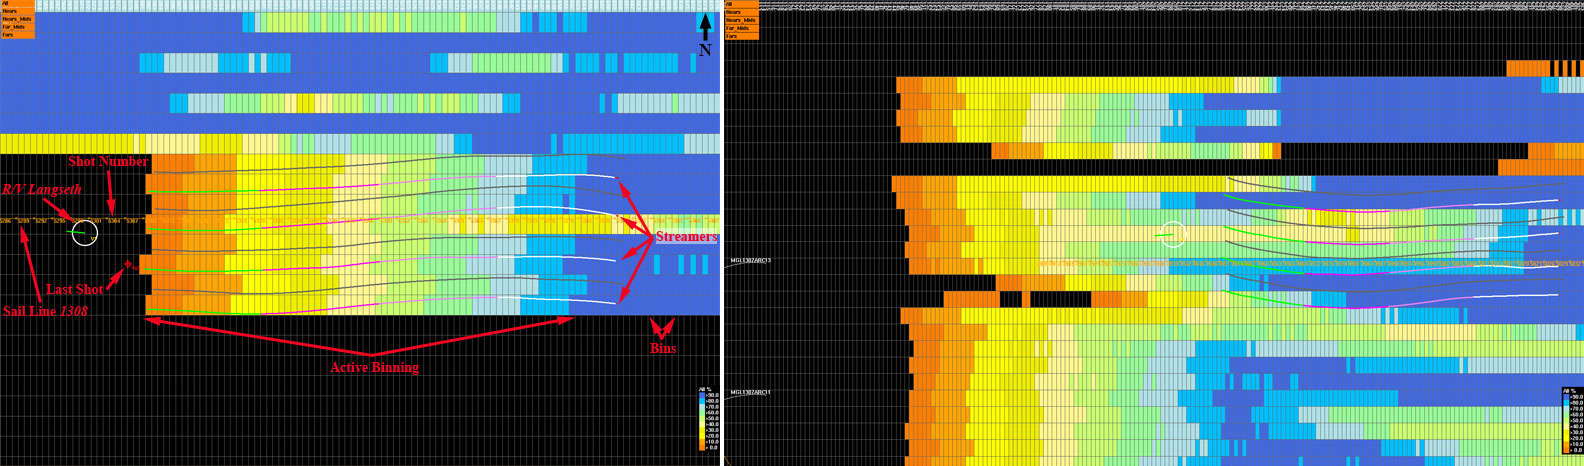 |
| A screen capture of the Spectra display. The image on the left shows active binning of the MCS data. The image on the right shows the bins being infilled (filling holes). |
We are getting to the end of the "No Mores," which means we are finished on Friday!! Stay tuned for a word from our Chief Scientist along with a look at the MCS data (and our cruise pic).
James Gibson
Lamont-Doherty